Listings and capital raises on the TSX Venture Exchange (TSXV) have been choppy in 2019. As of July 31, 2019, there has been a total of 86 going public/new listing transactions on the TSXV (July 2018 – 120). [1]
From 2009 to 2013 the number of listings on the TSXV stayed within a 5% range of 2,150 issuers. There has been a steady drop since that date with a small recovery in 2018 to 1,707 listed issuers (July 2019 – 1,700). The TSXV should net around the same number by year end as dormant issuers are moved to the NEX board and new companies list this fall.
Issuers to date have raised $2,132,000 (July 2018 – $4,782,000), a drop of 55% as compared to this time last year. In 2018 issuers raised a total of $6,796,800 in 1,701 financing with an average raise of $4 million per financing. 2010 and 2011 in hindsight are now looking like an anomalies versus the return to the financing norms of the TSXV for issuers in earlier years. In 2011 issuers raised $10,096,200 in 2,252 financings with an average raise of $4.5 million per financing. In 2010 issuers raised $9,831,700 in 2,603 financings with an average raise of $3.8 million per financing. The total number of financings per year on the TSXV has been on a downward trend over the last ten years.
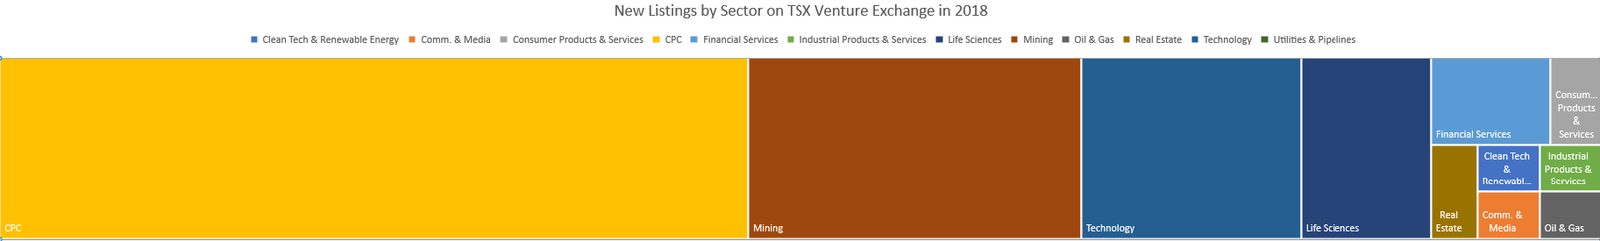
The chart below breaks down the new listings and equity capital raises of issuers listed on the TSXV over the last five years. Let’s hope, for the junior capital markets and Canada’s economy, the TSXV has a quick bounce to healthier numbers in 2020.
TSX Venture Exchange (TSXV) Listing and Financing Chart [1]
| 2018 | 2017 | 2016 | 2015 | 2014 | ||
| Number of Issuers | 1,707 | 1,653 | 1,648 | 1,791 | 1,971 | |
| QMV (C$ Billions) | 45.0 | 53.9 | 38.1 | 23.2 | 26.6 | |
| Going Public Activity/New Listings | 212 | 143 | 104 | 87 | 122 | |
| IPOs (excluding CPCs/ETFs/SPs) | 13 | 11 | 1 | 4 | 8 | |
| CPC IPOs | 95 | 37 | 17 | 14 | 21 | |
| ETF & SP IPOs | ||||||
| Qualifying Transactions (QTs) | 48 | 38 | 29 | 25 | 46 | |
| TSXV RTOs | 10 | 12 | 13 | 12 | 18 | |
| NEX RTOs | 8 | 11 | 6 | 3 | 2 | |
| Other | 38 | 34 | 38 | 29 | 27 | |
| Equity Capital Raised (C$ Millions) | 6,796.8 | 6,102.1 | 4,408.4 | 3,345.3 | 5,231.9 | |
| Initial Public Offerings | 70.7 | 97.0 | 33.5 | 43.7 | 119.0 | |
| Public Offerings/Supplementary | 2,061.3 | 1,825.0 | 977.0 | 744.2 | 1,376.1 | |
| Private Placements | 4,664.8 | 4,180.1 | 3,397.9 | 2,557.4 | 3,736.8 | |
| Avg Raise Size (C$ Millions) | 4.0 | 3.5 | 2.8 | 2.6 | 3.3 | |
| Number of Financings | 1,701 | 1,752 | 1,549 | 1,279 | 1,572 | |
| Volume Traded (Billions of Shares) | 48.5 | 49.3 | 43.0 | 32.4 | 38.3 | |
| Value Traded (C$ Billions) | 30.2 | 23.0 | 15.1 | 9.5 | 14.9 | |
| # of Trades (Millions) | 13.0 | 9.4 | 6.5 | 4.1 | 5.9 | |
| S&P/TSX/TSXV Composite Indices | 557.2 | 850.7 | 762.4 | 525.7 | 695.5 | |
| TSXV Graduates to TSX | 12 | 15 | 16 | 9 | 22 | |
Notes:
- All numbers in this article, including the chart below, is based on the Market Intelligence Group’s MiG Reports indexed by the TSX Group here:
https://www.tsx.com/listings/current-market-statistics/mig-archives